May 2024 year over year comparison - Phoenix Metro:
Median Sales Price: Up +1.58% from $443,000 to $450,000
Average Sales Price: Up +2.12% from $575,584 to $587,786
Sales: Down -15.19% from 7,260 to 6,157
Active Listings: Up 57.21% from 11,407 to 17,933
Median Days on Market: Up 14.63% from 41 to 47
Months Supply of Inventory: Up 85.37% from 1.57 to 2.91
| June 2024 | |
| File Size: | 1997 kb |
| File Type: | |
ARMLS® COPYRIGHT 2024
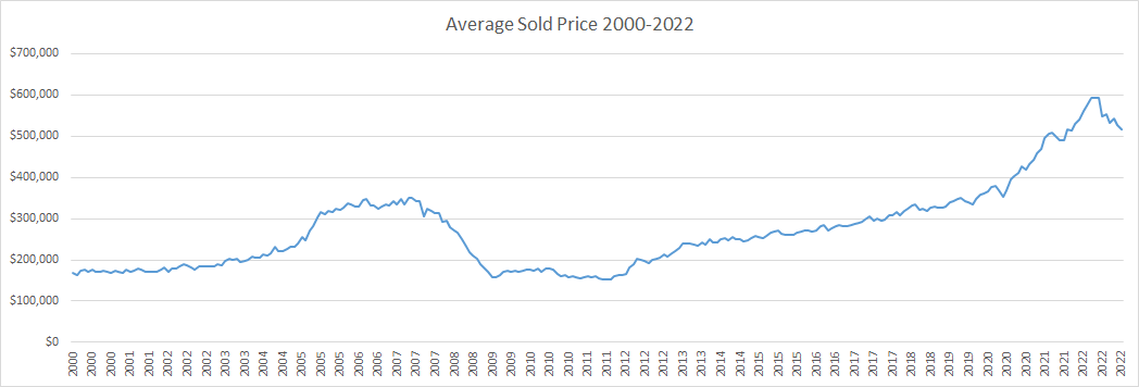
Average Monthly Sold Price in Metro Phoenix 2000-2022
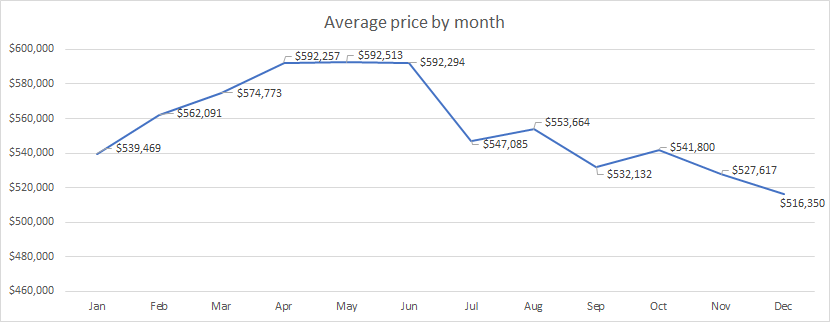
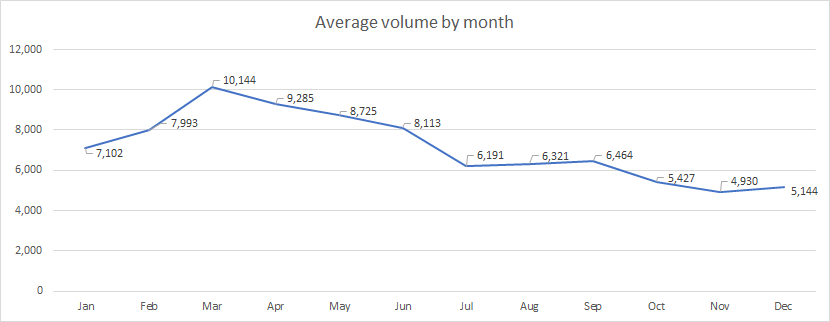
2022 Sales By Month
Houses sold in 2022 by year built
All data is obtained from analyzing ARMLS sales records. Incorrect information added by other agents may skew stats!


