November 2019 year over year comparison - Phoenix Metro:
Median Sales Price: Up 8.2% from $262,000 to $283,500 (forecast next month: $287,900)
Average Sales Price: Up 8.7% from $326,500 to $354,900
Sales: Up 7% from 6,515 to 6,974
Total Inventory: Down -19.1% from 21,477 to 17,370
Foreclosures Pending: Down -15.7% from 2,666 to 2,248
Average Days on Market: Down -6 days from 64 to 58
Months Supply of Inventory: 2.49
| November 2019 Stats |
ARMLS® COPYRIGHT 2019
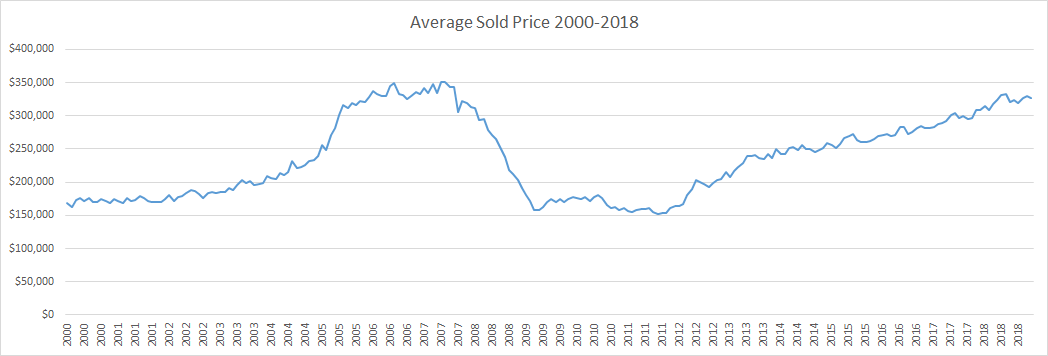
Average Monthly Sold Price in Metro Phoenix 2000-2018
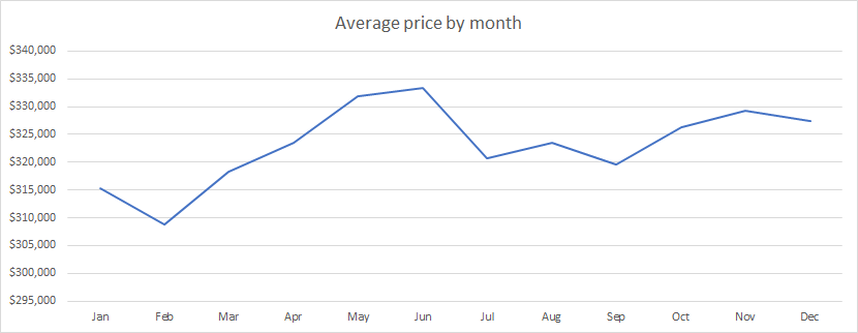
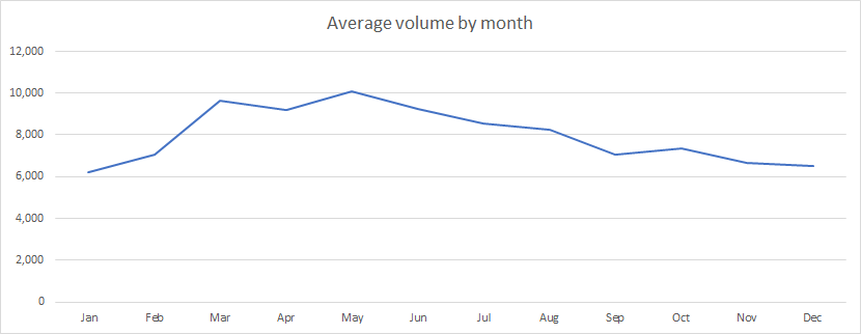
2018 Sales By Month
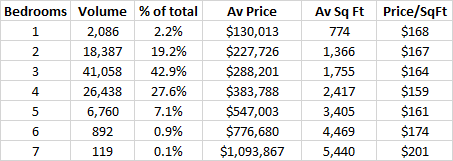
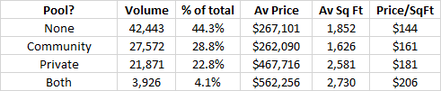
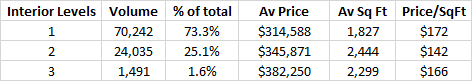
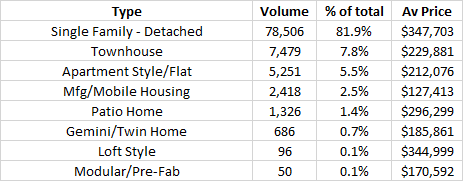
Percentage of houses sold in 2018 by bedrooms, interior levels, pool, type
|
|
*Houses with pools are often larger - price difference likely due to location and size - not pool!
Houses sold in 2018 by city - sorted by volume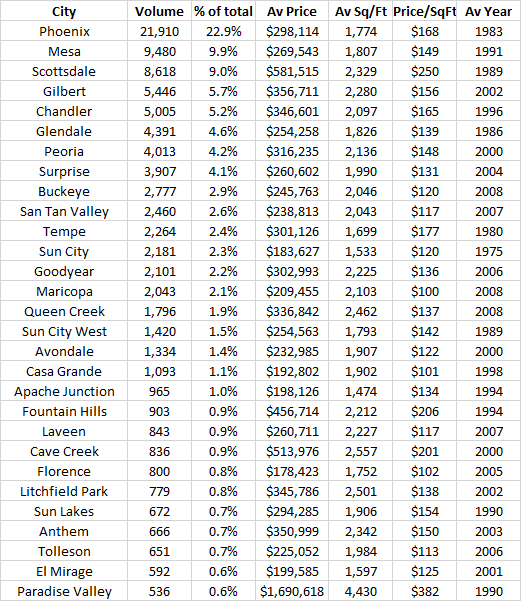
|
Houses sold in 2018 by city - sorted by price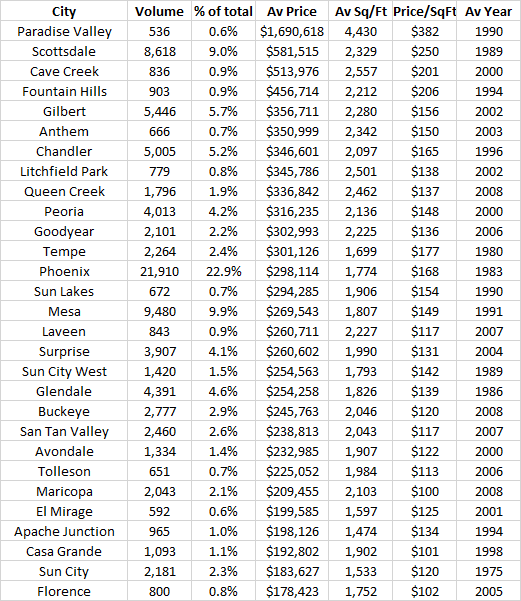
|
Excludes small cities with fewer than 500 transactions
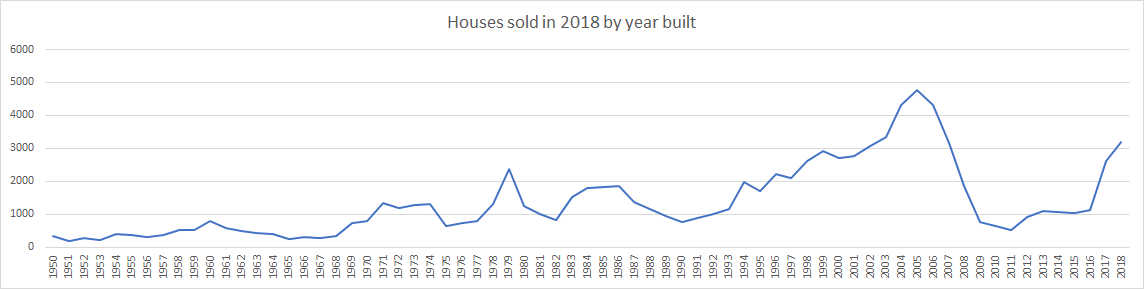
Houses sold in 2018 by year built
All data is obtained from analyzing ARMLS sales records. Incorrect information added by other agents may skew stats!